
CIMAPRO17-BA1-X1-ENG Exam Questions & Answers
Exam Code: CIMAPRO17-BA1-X1-ENG
Exam Name: BA1 - Fundamentals of Business Economics Question Tutorial
Updated: Apr 25, 2024
Q&As: 60
At Passcerty.com, we pride ourselves on the comprehensive nature of our CIMAPRO17-BA1-X1-ENG exam dumps, designed meticulously to encompass all key topics and nuances you might encounter during the real examination. Regular updates are a cornerstone of our service, ensuring that our dedicated users always have their hands on the most recent and relevant Q&A dumps. Behind every meticulously curated question and answer lies the hard work of our seasoned team of experts, who bring years of experience and knowledge into crafting these premium materials. And while we are invested in offering top-notch content, we also believe in empowering our community. As a token of our commitment to your success, we're delighted to offer a substantial portion of our resources for free practice. We invite you to make the most of the following content, and wish you every success in your endeavors.

Download Free CIMA CIMAPRO17-BA1-X1-ENG Demo
Experience Passcerty.com exam material in PDF version.
Simply submit your e-mail address below to get started with our PDF real exam demo of your CIMA CIMAPRO17-BA1-X1-ENG exam.
![]() Instant download
Instant download
![]() Latest update demo according to real exam
Latest update demo according to real exam
* Our demo shows only a few questions from your selected exam for evaluating purposes
Free CIMA CIMAPRO17-BA1-X1-ENG Dumps
Practice These Free Questions and Answers to Pass the CIMA Certifications Exam
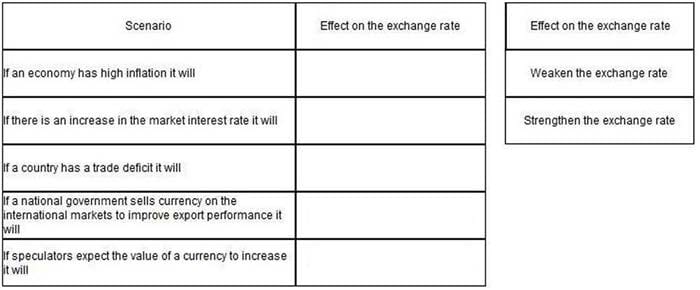
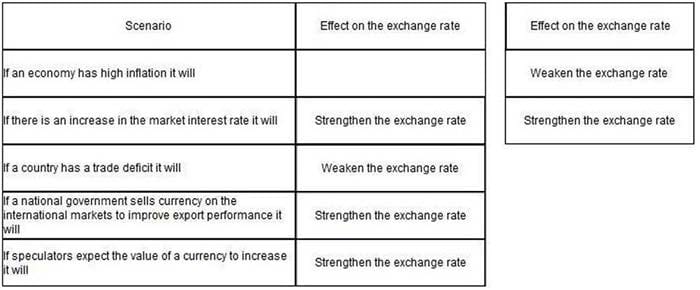
DRAG DROP
Complete the table inputting the relevant effect for each of the scenarios listed.
Select and Place:
The following scatter diagram displays the total life expectancy in years on the X axis and GDP per capita (constant 2000 $) on the Y axis, in Country S for the past 40 years. Which of the following statements is true in respect of the graph?
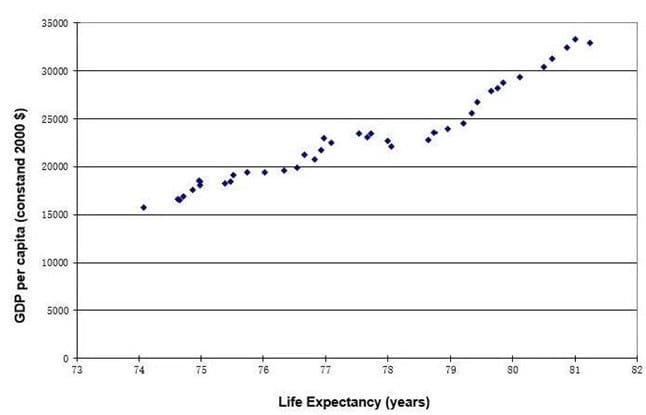
A. A perfect positive linear relationship is shown in the diagram.
B. In most years, the samples shows a clear negative trend in the diagram.
C. There is no correlation between the level of GDP per capita and life expectancy.
D. In some years, the level of GDP per capita and life expectancy moved in opposite directions.
A business has a short-term problem with its payments exceeding its receipts. Which TWO of the following would be appropriate for meeting this financial shortfall? (Choose two.)
A. A bank overdraft
B. A bill of exchange
C. A mortgage
D. Issuing shares
E. A leasing arrangement
Which THREE of the following are characteristics of good information? (Choose three.)
A. Accuracy
B. Confidentiality
C. Verifiability
D. Accessibility
E. Trustworthiness
F. Relevance
Country A's tax system is one where every citizen pays tax on earned income over $12,000 per year. The amount of tax paid as a percentage of income rises as individuals income levels rise.
Which of the following describes the nature of the tax paid by individuals in Country A?
A. Progressive
B. Regressive
C. Retentive
D. Proportional
Viewing Page 1 of 3 pages. Download PDF or Software version with 60 questions

Home | Contact Us | About Us | FAQ | Guarantee & Policy | Privacy & Policy | Terms & Conditions | How to buy
Copyright © 2024 passcerty.com. All Rights Reserved