
CLSSBB Exam Questions & Answers
Exam Code: CLSSBB
Exam Name: Certified Lean Six Sigma Black Belt (CLSSBB)
Updated: Apr 19, 2024
Q&As: 639
At Passcerty.com, we pride ourselves on the comprehensive nature of our CLSSBB exam dumps, designed meticulously to encompass all key topics and nuances you might encounter during the real examination. Regular updates are a cornerstone of our service, ensuring that our dedicated users always have their hands on the most recent and relevant Q&A dumps. Behind every meticulously curated question and answer lies the hard work of our seasoned team of experts, who bring years of experience and knowledge into crafting these premium materials. And while we are invested in offering top-notch content, we also believe in empowering our community. As a token of our commitment to your success, we're delighted to offer a substantial portion of our resources for free practice. We invite you to make the most of the following content, and wish you every success in your endeavors.

Download Free GAQM CLSSBB Demo
Experience Passcerty.com exam material in PDF version.
Simply submit your e-mail address below to get started with our PDF real exam demo of your GAQM CLSSBB exam.
![]() Instant download
Instant download
![]() Latest update demo according to real exam
Latest update demo according to real exam
* Our demo shows only a few questions from your selected exam for evaluating purposes
Free GAQM CLSSBB Dumps
Practice These Free Questions and Answers to Pass the GAQM certification Exam
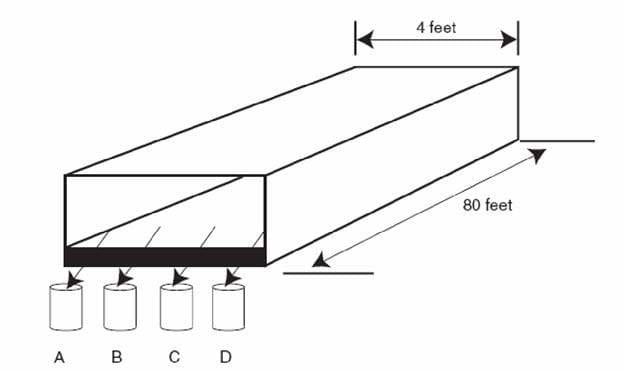
SCENARIO A Six Sigma team is measuring the moisture content of corn starch as it leaves the conveyer belt of a dryer. They collect one sample four cups of starch at times indicated in the chart at fixed locations labeled A, B, C, and D across the end of the belt. See the diagram below.
Find the equation of the regression line for these sample data points: (1, 7) (3, 3) ( 3, 2) (5, ?)
A. y = 10.8 ?2.9x
B. y = 12.9 + 5.2x
C. y = 16 ?3.7x
D. y = 8.75 ?2x
E. y = 22.6 ?4.8x
As a means of measuring the effects on other areas of a process as a result of changes in the primary metric we also define and track ________________.
A. Parallel process metrics
B. Secondary metrics
C. Tertiary metrics
D. Industry standards
An ANOVA used across many dependent variables could increase the Beta risk.
A. True
B. False
A Non-parametric Test should be used if just one distribution is not Normal out of the two or more gathered.
A. True
B. False
Range Charts are the technique used to determine if ______________ are occurring within the subgroups of the SPC Charts.
A. Common Causes
B. Special inspections
C. Unnatural forces
D. Special Causes
Viewing Page 1 of 3 pages. Download PDF or Software version with 639 questions

Home | Contact Us | About Us | FAQ | Guarantee & Policy | Privacy & Policy | Terms & Conditions | How to buy
Copyright © 2024 passcerty.com. All Rights Reserved